
Decline of News-on-paper: United States
Mapping the decline of news-on-paper
[Latest update: December 15, 2017]
The Newspaper Extinction Timeline, released in 2010, predicted that news-on-paper would become “insignificant” in the U.S. Read the Review of the Newspaper Extinction Timelinefor full context.
This page compiles some of the most recent available data on the state of news-on-paper in the U.S. Note that there are massive challenges to gaining an accurate current view of the state of news-on-paper.
- The Newspaper Association of America (now renamed News Media Alliance) stopped providing detailed industry information in 2013.
- Publicly listed news organizations have been largely very opaque in providing details on their print revenue and circulation.
- Almost all so-called “newspaper circulation” figures available include both paper and digital formats. Most of the data below includes both paper and digital so does not provide real insight into the state of news-on-paper.
However the most important issue is NOT the decline of news-on-paper, but from the position we are in today how we can best create a positive future for the news industry over all channels.
More than a 1/3 of paid daily newspaper circulation has disappeared over 10 years
At the turn of the century, newspaper circulation in the United States rested at a relatively stable level of approximately 55 million copies a year. Nevertheless, ever since peaking in the late 1980s—hitting 62.82 million in 1987—the circulation of paid daily newspapers has consistently declined.
[NOTE: Figures include both print and digital]
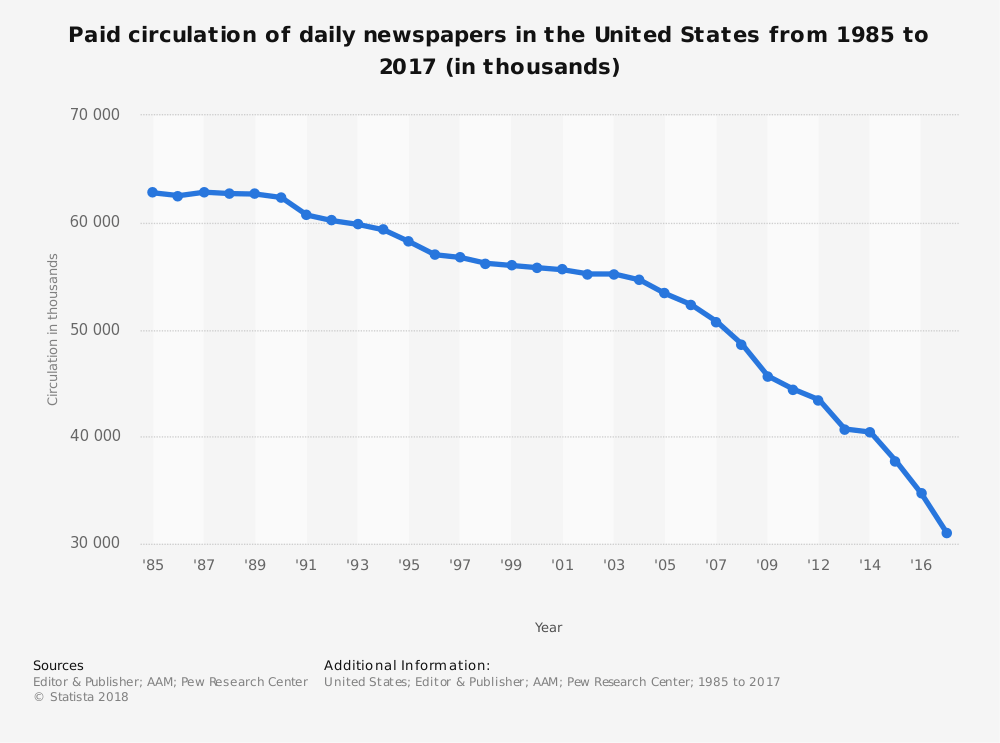
Data sources: Editor & Publisher; Alliance for Audited Media; Pew Research Center Chart source: statista
The pace of decline accelerated in 2004 (54.63 million), but not precipitously, resulting in a drop of more than 36% by 2016 (34.66 million). According to the last ten years of recorded data (2006-2016) supplied in the chart above, paid daily newspaper circulation sunk 34%.
To take a closer look at the yearly circulation numbers, statista provides an interactive version of the chart above as well as multiple options for downloading the information.
2016 circulation for both Weekday and Sunday editions has plunged to the lowest figures since 1945
[NOTE: Figures include both print and digital]
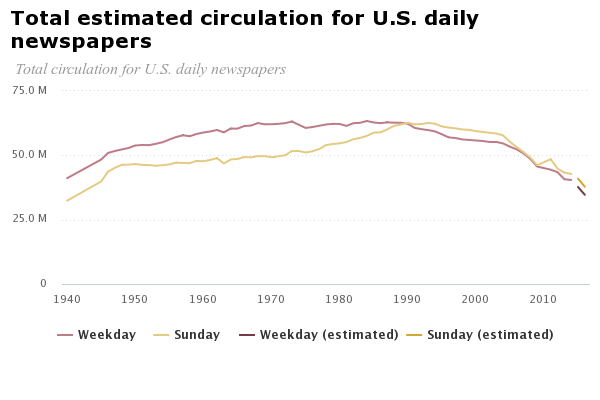
Data sources: Editor & Publisher (through 2014); estimation based on Pew Research Centeranalysis of Alliance for Audited Media data (2015-2016). Chart source: Pew Research Center
The Pew Research Center offers deeper insight into the decline of newspapers in the United States, providing separate circulation data for Weekday and Sunday daily newspapers. The center’s analysis shows that in 2016 both hit their lowest levels since 1945, with circulation figures of 35 million and 38 million respectively.
Advertising revenue dropped nearly two-thirds between 2005 and 2016, while circulation revenue rose slightly
[NOTE: Figures include both print and digital]
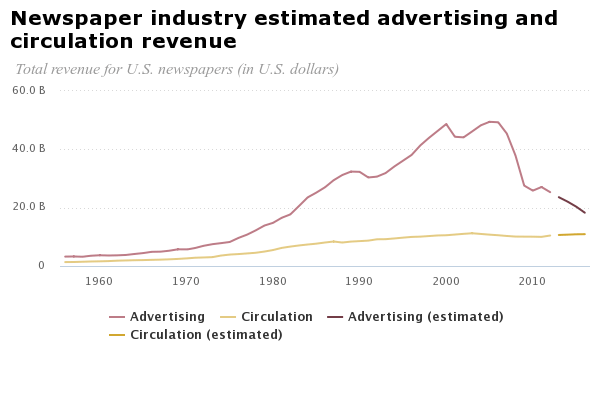
Data sources: News Media Alliance, formerly Newspaper Association of America, (through 2012); Pew Research Center analysis of year-end SEC filings of publicly traded newspaper companies (2013-2016). Chart source: Pew Research Center
The Pew Research Center also analyzed advertising and circulation revenue for U.S. newspapers over a 60-year period starting in 1956. Although circulation earnings have gradually increased, total advertising revenue fell significantly between 2005 and 2016. During these 11 years, total advertising revenue for the industry plummeted by nearly two-thirds, decreasing from $49 billion to $18 billion. The bulk of advertising revenue still comes from print, compromising approximately 80% in 2011 and dropping to close to 70% in 2016.
We recommend the valuable Pew Reseach Center website on Journalism & Media, which is compiled from a variety of industry resources.
Print became the least popular news source in 2014, continuing to fall through 2017 down to 22% weekly consumption
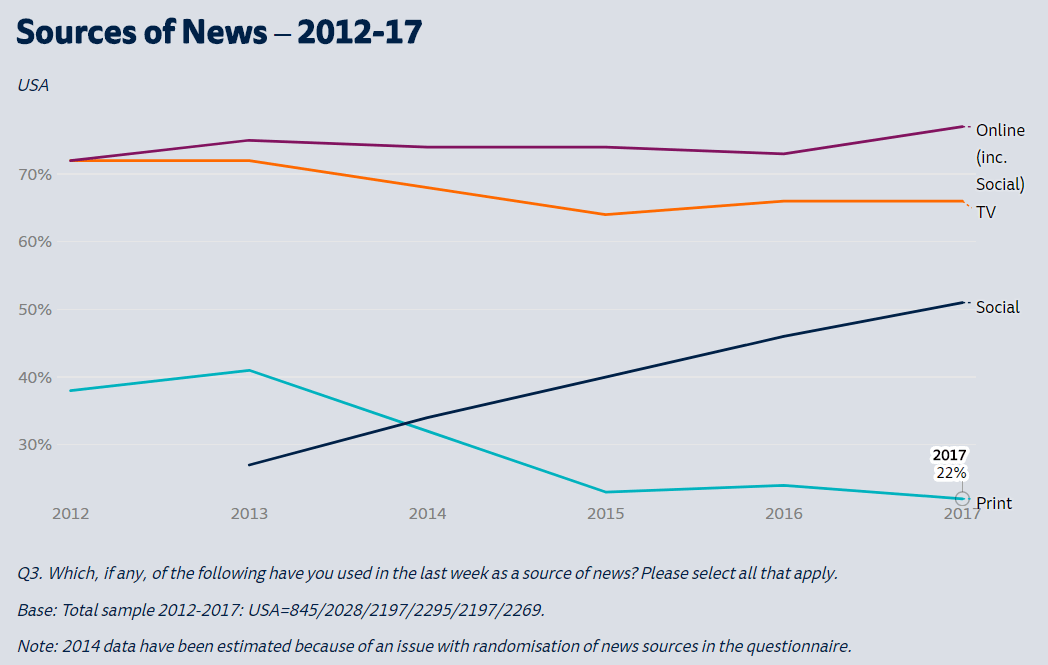
Data and chart source: Reuters Institute Digital News Report 2017
From 2013 to 2017, the number of people who read print newspapers decreased by almost one-fifth. As the medium dropped out of favor, social media as a news source enjoyed a steady climb, with consumption growing by about 6% each year.
Each year since 2012, the Reuters Institute in partnership with the University of Oxford has released a digital news report offering insights into the transition to online news and its effect on the media landscape. Although the first report covered just five countries, the latest included survey data from 70,000 participants across 36 countries.
For people wanting to delve deeper and compare data between and within countries, we strongly recommend reading the latest report and using the interactive feature to create your own charts.
The New York Times, The Washington Post, and The Wall Street Journal are uniquely positioned to monetize print but its role is rapidly declining
The New York Times, The Washington Post, and The Wall Street Journal are distinct from other newspapers in the U.S. in that they are truly national and in fact arguably global “newspapers of record”. All three have made a concerted and successful shift to digital subscriptions and advertising. However, their role means that the role of print in their business models continues to be solid.
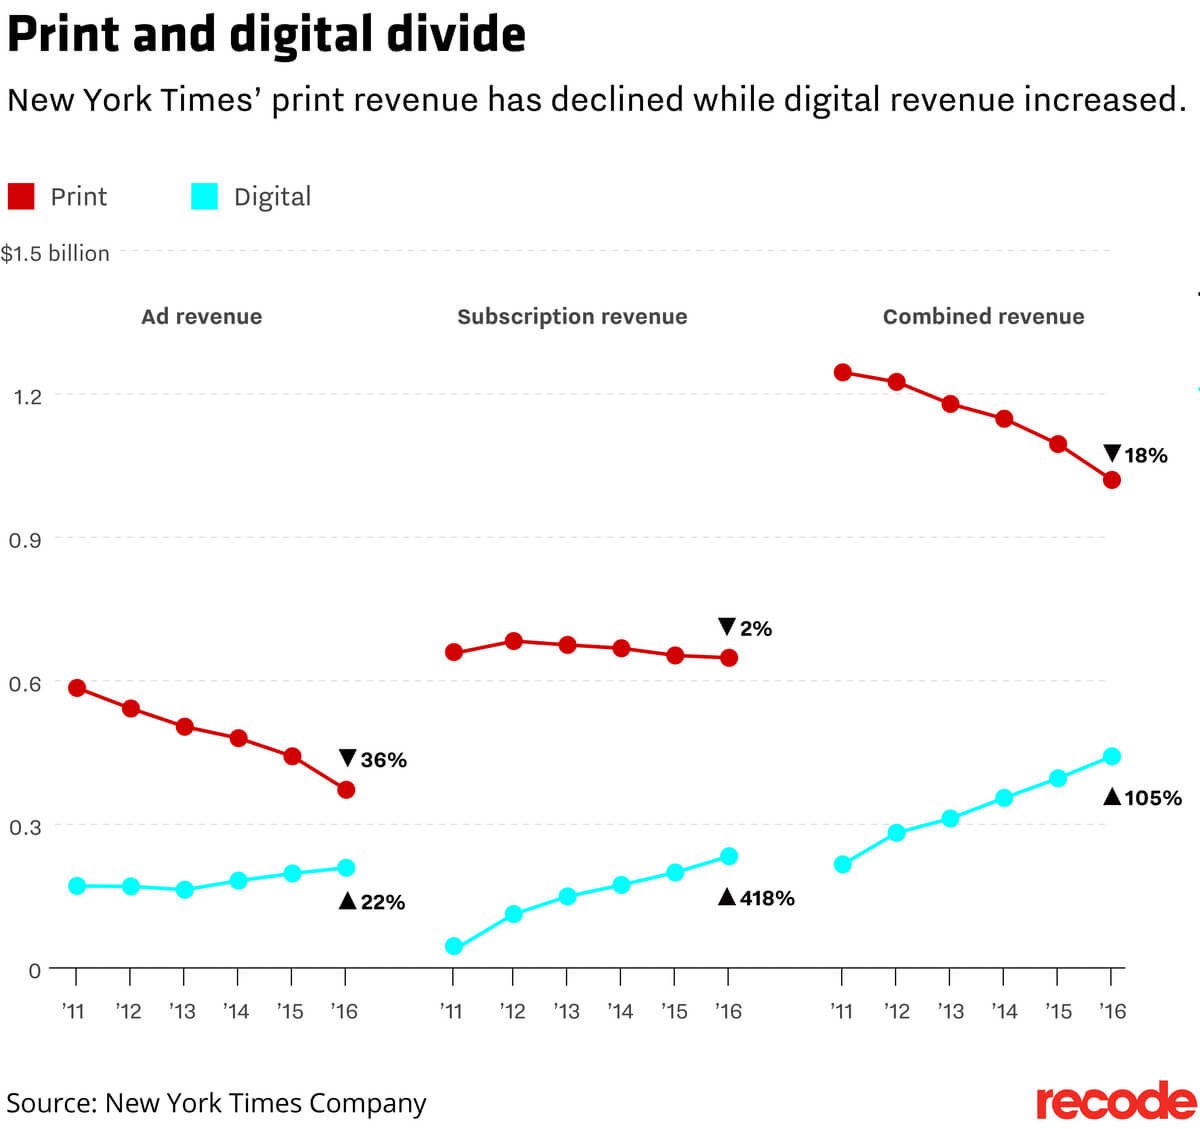
These uniquely successful news organizations recognize that they may not continue indefinitely on print. New York Times’ CEO Mark Thompson says in an interesting interview in Nieman Lab on when to stop the presses forever:
“The print product is a mature platform. It is, as you say, an economically important platform to us. It’s possible that platform will plateau. I think it’s more likely that the platform will eventually go away. It’ll go away because the economics will no longer make sense to us or our customers.”
Weekly community newspapers are severely challenged but are likely to have further life
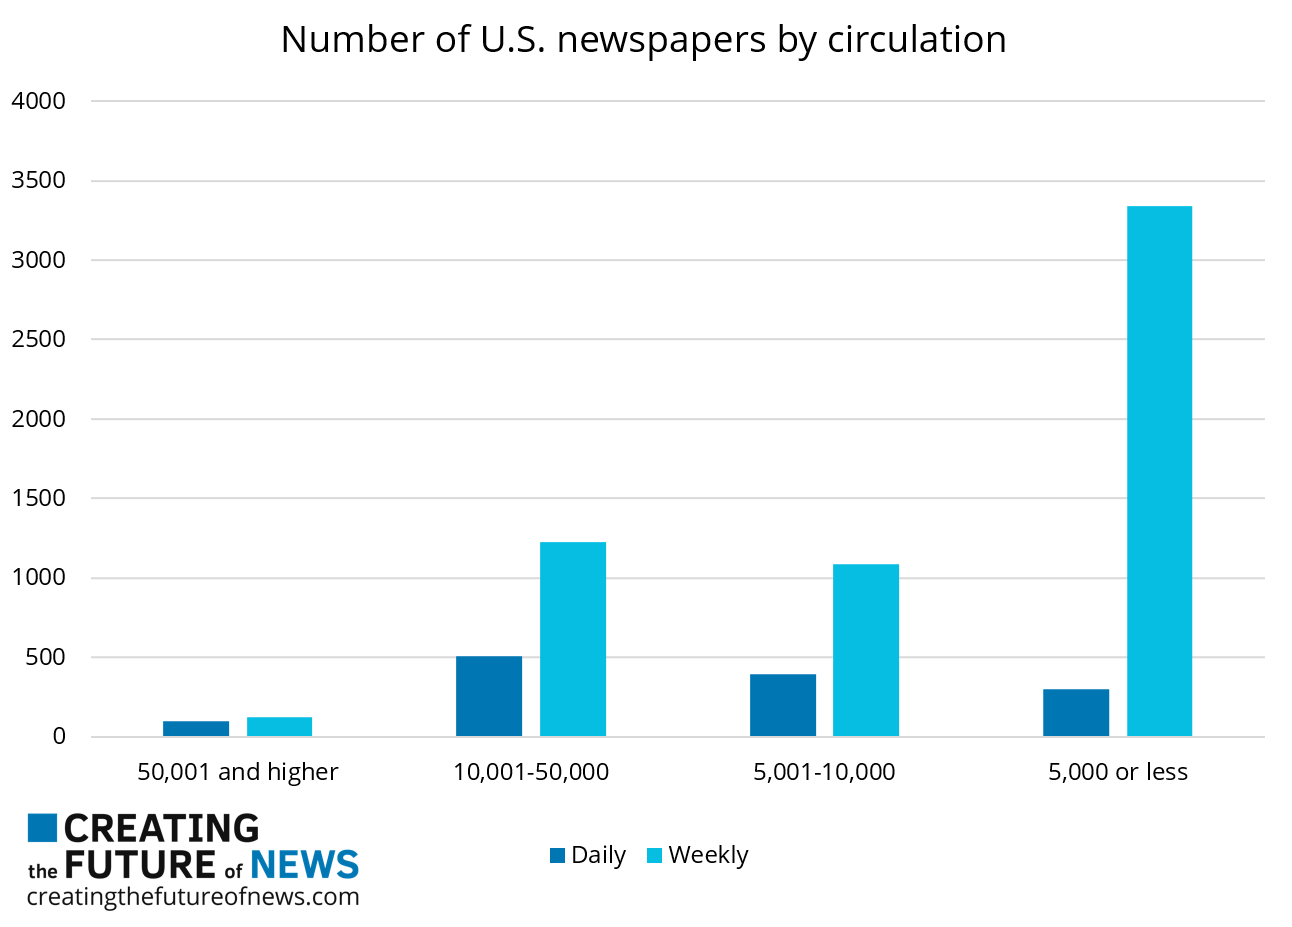
There remain many newspapers across the US, primarily weekly, with small circulations but advertising revenues that are sometimes not eroding as fast as larger newspapers due to their highly geographically focused audiences and unique content.
Data source: Editor & Publisher, American Press Institute, Columbia Journalism Review
An excellent report from Columbia Journalism Review’s Tow Center on Small-market newspapers in the digital age provides strong insights into the state of the sector and some of the ways community newspapers are successful responding to change.
Since September 2005, employment in the U.S. newspaper industry has dropped by more than half
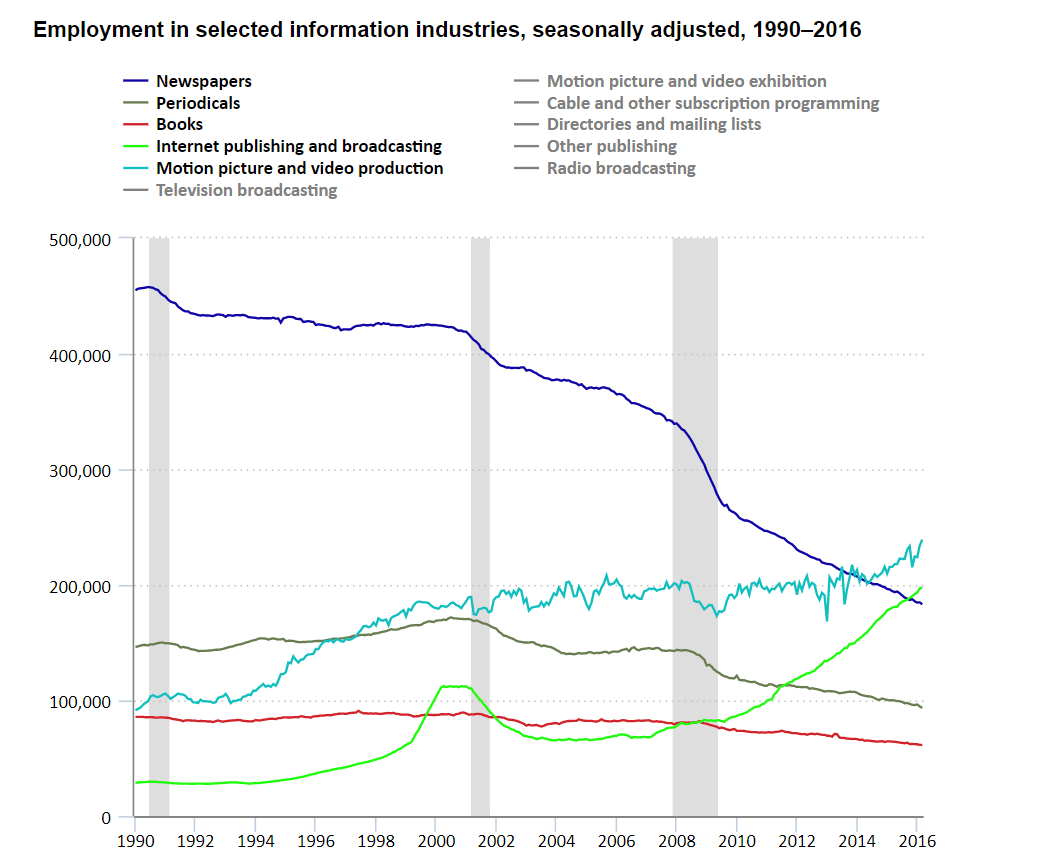
Note: Shaded areas represent recession, as determined by the National Bureau of Economic Research.
Data and chart source: U.S. Bureau of Labor Statistics
U.S. Newspaper employment:
January 1990: 455,000 (62% decline since this date)
January 2010: 260,800 (33% decline since this date)
September 2016: 173,700
The U.S. Bureau of Labor Statistics also provides the above chart in an interactive format. Users can explore the data further by hovering their cursors over the lines representing the different information industries or by clicking on the “Chart Data” tab to view it in a table format.
NOTE: “Newspaper employment” includes staff working on both print and digital editions, a fraction of these figures work