
Key trends in media and communications usage
Ofcom, UK’s communications regulator, annually produces what is the most detailed study of the local communications marketplace available anywhere in the world. Every year it provides deep insights into many aspects of media and communications usage and the state of the industry, and Communications Market Report 2010 is another gem.
Depending on your interests different data will come out – here are some of the results I found interesting. All charts are from the Ofcom report.
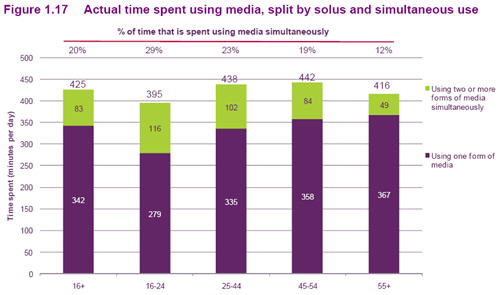
The results that have received the most attention is the multi-tasking in media usage. Everyone multi-tasks, but younger people more, to the point of 29% of media usage being concurrent in 16-24 year olds. Back in our Future of Media Report 2006 we described how simultaneous use of media would drive future media consumption.
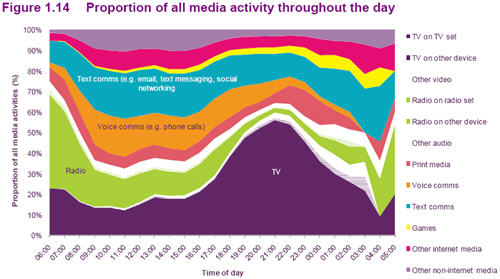
The balance of media activities through the day shows the predominance of TV, particularly in the evening, with a strong shift from voice to text communication in the wee hours.
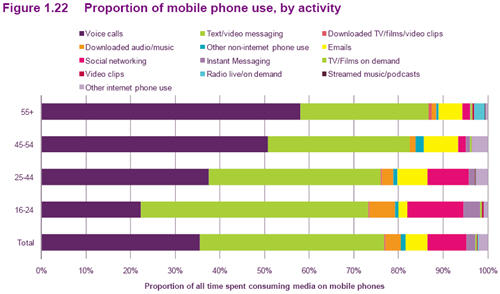
Even over 55 year olds spend less than 60% of their mobile use on calls, with people 16-44 years old spending close to a quarter of their time on media consumption.
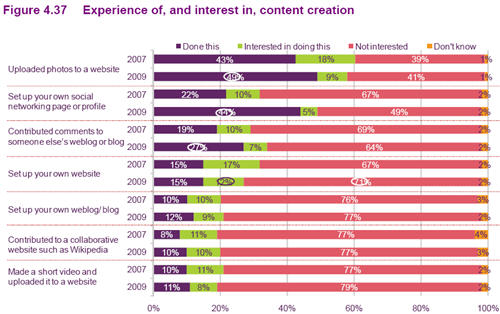
Rates of online content creation rose significantly from 2007 to 2009, with in particular twice as many (44%) people having set up a social networking profile, and 50% more (27%) having commented on a blog. The drop from 67% to 49% in those saying they were “not interested” in setting up a social network profile shows those saying they are not interested in activities could later change their mind.
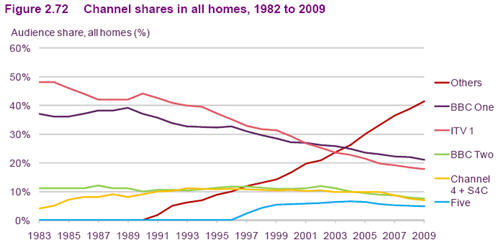
This chart of channel shares is one of the most compelling I have seen showing the inexorable trend to media fragmentation. In every market, incumbents will be squeezed by new entrants and other choices. I may use this chart in presentations, supplanting others I have used, for example in our Seven Driving Forces of Media infographic.
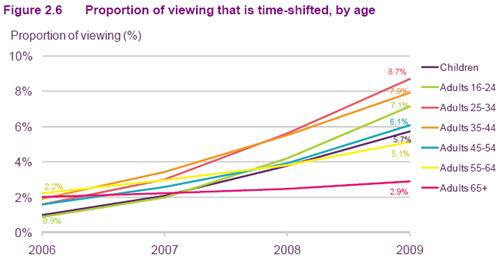
The growth of timeshifting will continue across channels. While people will still seek a shared viewing experience for some programs, particularly as the growth of broadcast backchannels such as Twitter grows, the majority of viewing is likely to be timeshifted.
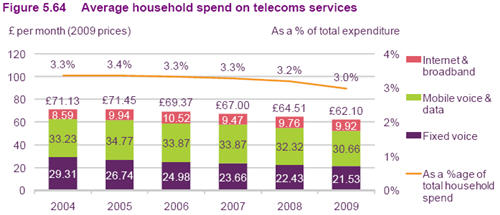
I have been interested in trends in the communications share of consumer spend for a long time, and the statistics shown here are consistent with those over a decade ago – basically our share of spend on communications is highly stable through business cycles and technological change. The drop in 2009 is intriguing, and it will be very interesting to see whether this was a function of the economic downturn or something else. Most likely it will return to previous levels.