
Periodic Table of Disruptive Technologies and Innovation
My colleague and friend Richard Watson and I have created a number of visual frameworks together over the years, including the Trend Blend series , the original Extinction Timeline and What will appear and disappear.
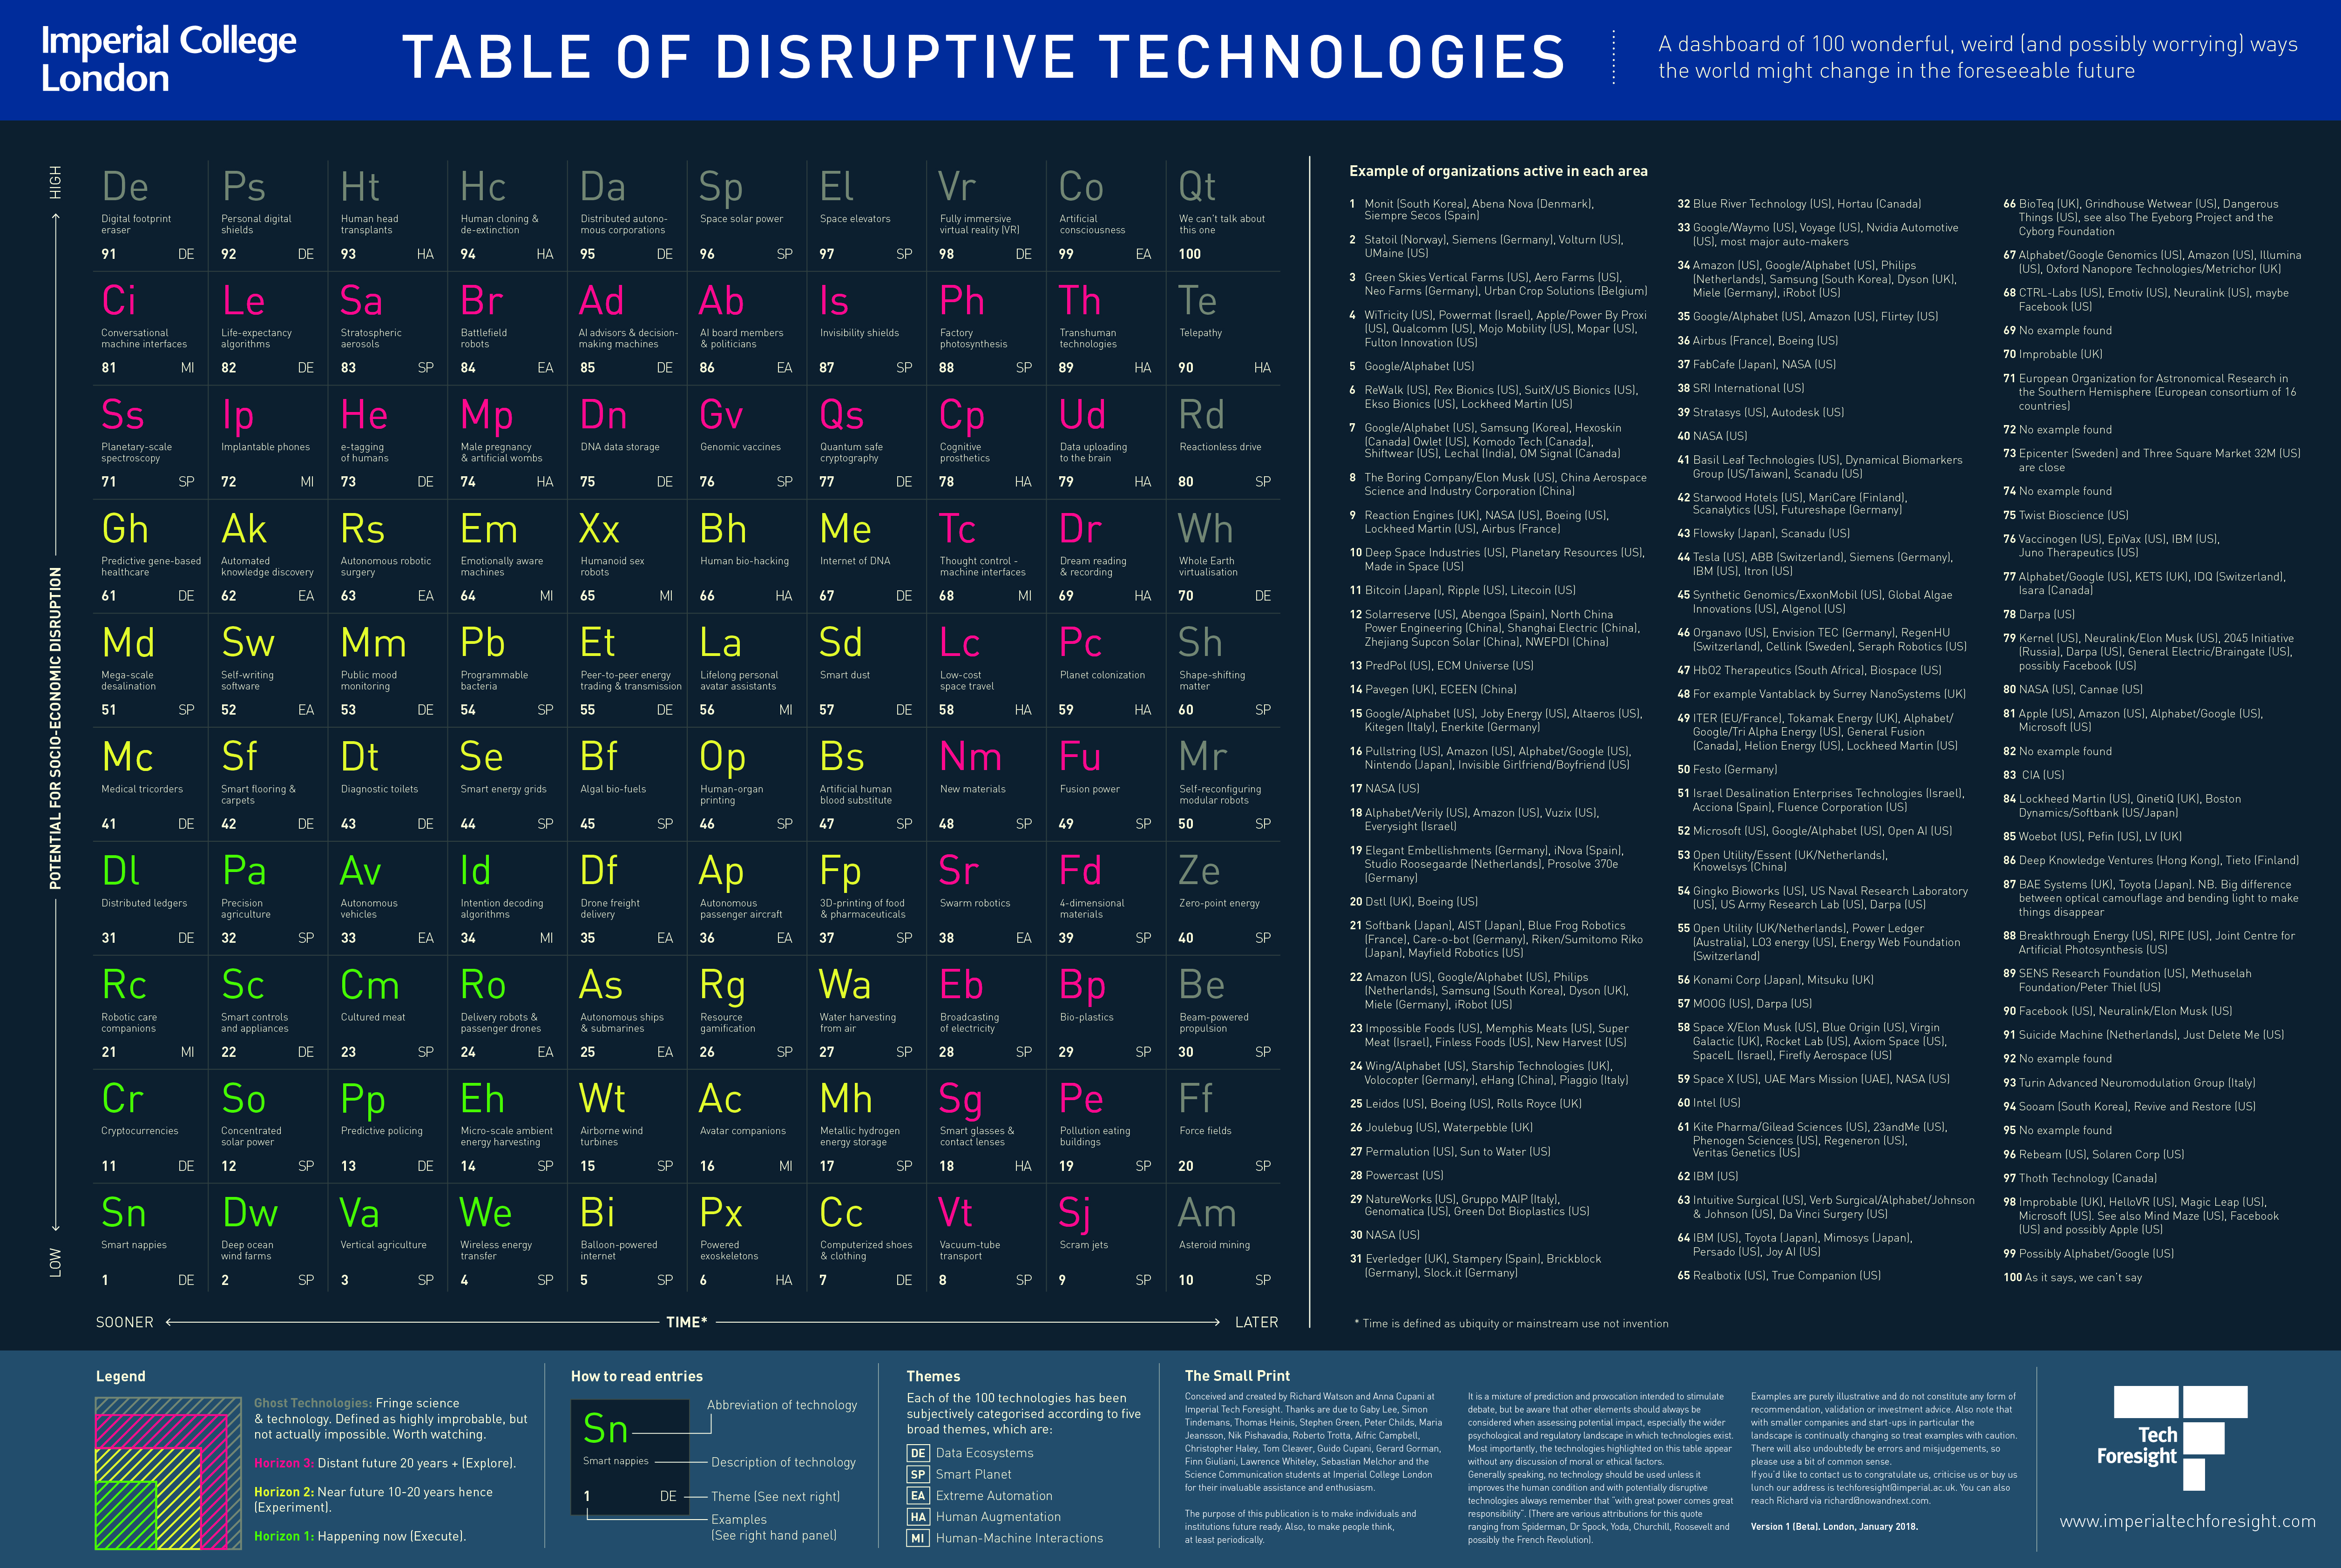
Richard has continued to create wonderful frameworks, with his latest a Periodic Table of Disruptive Technologies and Innovation (full size 9MB)
Click on the image for full size version (9MB)
I highly recommended reading Richard’s full explanation of the genesis and creation of the Table. A summary explanation is below.
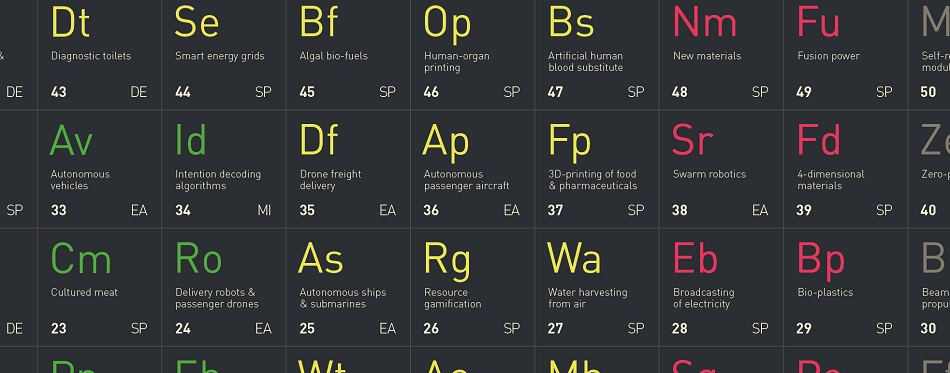
The table consists of 100 potentially disruptive technologies, which we have defined as new technologies capable of significant social, economic or political upheaval.
One axis (Y Axis) ranks potential for disruption from high to low, while the other (X Axis) is time ranked from sooner to later. Importantly, time relates to common usage or ubiquity, not initial invention. All very subjective, I know, but it has been thought about quite a bit.
The 100 technologies (99 really) are then divided into four groups. Horizon one technologies (green on the table) are new technologies that are happening right now. Companies should be integrating and executing these technologies right now if they are appropriate.
Horizon two technologies (yellow) are probable near future technologies (10-20 years hence). Companies should be experimenting and discussing these technologies now.
Horizon three technologies (red) are things that are likely to emerge in the more distant future (20 years plus). Companies should keep an eye on developments in these areas and explore when appropriate.
The outer edge of the table (grey) contains what we’ve termed Ghost Technologies. This is the really good bit! This is fringe thinking territory with some ideas bordering on complete lunacy. However, while each example is highly improbable, very few, if any, are totally impossible.
Each of the 100 technologies has then been given an abbreviation, followed by a very brief and hopefully self-explanatory description. Each technology is then categorized according to one of five subjective themes (Data Ecosystems, Smart Planet, Extreme Automation, Human Augmentation and Human-Machine interactions).
In particular go to Richard’s post for detailed background, sources, and a lovely set of photos chronicling how the table was developed. Marvellous stuff.

