Visualization: Social bookmarking in the enterprise
In our Implementing Enterprise 2.0 report, we created visual representations to help explain how the most important social media tools can be applied inside organizations.
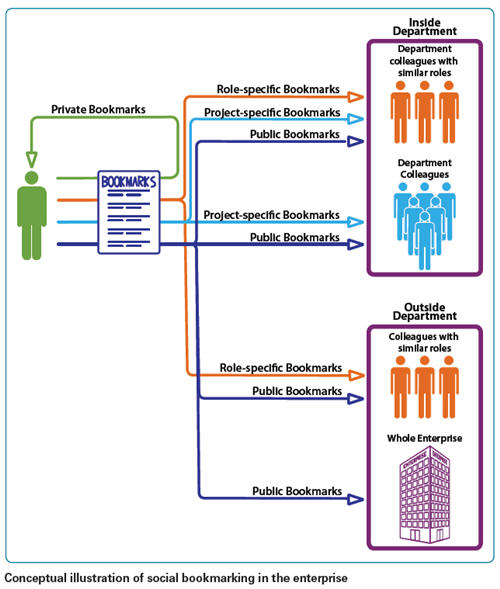
The diagram below was used in the chapter on social bookmarking, which was designed to accompany the detailed coverage in the report, but it is hopefully fairly self-explanatory!
Go to the Implementing Enterprise 2.0 downloads page for several free chapters, including the chapter on social networking on the enterprise, with its own diagram on how social networks relate to other Enterprise 2.0 tools.
Please let me know your thoughts and feedback on improving these diagrams for future versions of the report. I’ll post more of these visualizations on this blog in coming weeks.